88% of business leaders say data literacy is as essential as the ability to write — yet 60% report a significant skills gap in their organisation. Here are the 10 skills that close it.
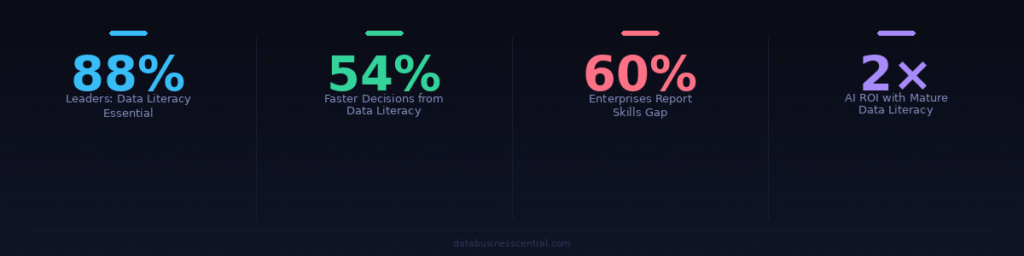
Data literacy has crossed the threshold from competitive advantage to baseline workplace expectation. According to DataCamp’s 2026 State of Data & AI Literacy Report — surveying 500+ US and UK enterprise leaders — nearly 9 in 10 rank basic data literacy as important or very important for day-to-day work. HR Dive reports that leaders now place it alongside writing as a fundamental professional skill. Not optional. Expected.
Yet the gap is stark: 60% of enterprise leaders say their organisation has a data skills gap, despite the majority already investing in training. The problem, as DataCamp identifies, is not a lack of tools or access to courses — it is a failure to build the foundational, interpretive, and applied skills that translate data access into business decisions.
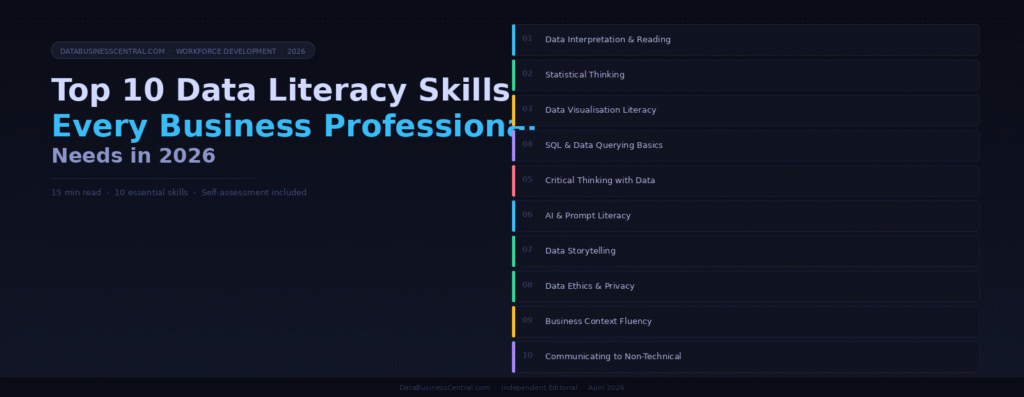
These are the 10 skills that matter most. Not the most technically complex — the most practically powerful.
Skill 01
Data Interpretation & Reading
The foundation — understanding what data is actually telling you
Foundational All Roles Daily Use
Before any analysis, model, or visualisation can add value, a professional must be able to read data in its raw form and understand what it represents. This means interpreting tables, reports, dashboards, and charts correctly — understanding what each number measures, what the units are, what time period is covered, and what the data source is.
This is the most universally required skill and the one most commonly assumed to be present when it isn’t. Employees can generate reports from a BI tool without understanding whether the metrics are meaningful, whether the date range is appropriate, or whether they are comparing like for like. The ability to read data critically — not just passively — is what separates data-literate professionals from those who mistake data access for data understanding.
How to Build It
Practice reading dashboards and reports in your own organisation before building new ones. For every metric, ask: what does this measure exactly? What does it exclude? What would make this number misleading? These three questions build interpretive rigour faster than any formal training.
Skill 02
Statistical Thinking
Understanding probability, variance, and what “significant” actually means
IntermediateAnalysis RolesDecision Making
Statistical thinking is the ability to reason probabilistically about data — understanding that all numbers have uncertainty attached to them, that correlations do not imply causation, that sample size matters, and that a metric moving by 3% may or may not be meaningful depending on the variance of that metric. Without this skill, professionals make confident decisions from noise.
This does not require a statistics degree. It requires enough foundational literacy to ask the right questions: Is this sample size large enough? Is this change statistically significant or within normal variation? Are we controlling for confounding variables? Business professionals who develop statistical intuition make materially better decisions — and are far harder to mislead with selectively presented data.
How to Build It
Study the basics of distributions, confidence intervals, and A/B test interpretation. Tools like Google’s free “Statistics for Data Science” course or Khan Academy’s statistics module cover 80% of what non-technical professionals need. Apply it immediately to any experiment or test result your team reviews.
Skill 03
Data Visualisation Literacy
Reading and creating charts that communicate clearly — not just look impressive
FoundationalAll RolesPresentations
Data visualisation literacy has two components: being able to correctly read and interpret charts someone else has created, and being able to choose the right chart type to represent your own data clearly. Both are more commonly absent than assumed. Pie charts used for time series, dual-axis charts that imply false correlations, and truncated y-axes that exaggerate small changes are pervasive in professional settings — and most audiences accept them uncritically.
As BI tools like Tableau and Power BI put chart creation in every professional’s hands, the ability to make sound visualisation decisions has become a universal workplace need. A chart that misleads — even unintentionally — can drive a wrong strategic decision with the same confidence as accurate data.
How to Build It
Read Cole Nussbaumer Knaflic’s Storytelling with Data — the most practical visualisation guide for business professionals available. Then audit your current dashboards: is every chart type the best choice for the data it represents? Could the same insight be communicated more clearly with a different format?
Skill 04
SQL & Data Querying Basics
The universal language for getting the data you actually need
TechnicalAnalystsOperations
SQL is the universal language for communicating with databases, and basic proficiency has moved from a specialist skill to a broadly expected capability for anyone working with structured data. The ability to write a SELECT query, filter results, join tables, and aggregate data independently removes a critical dependency on data engineering teams for routine analysis — and dramatically shortens the time between a business question and an answer.
In 2026, AI tools can assist with SQL syntax, but they cannot determine what questions are worth asking or validate whether a query is logically correct for the business problem at hand. That judgment still requires human fluency. Dataquest’s 2026 Skills Roadmap identifies SQL as one of the skills that “still matters most” regardless of how sophisticated AI coding assistance becomes.
How to Build It
Start with SQLZoo or Mode Analytics’ SQL tutorial — both are free, interactive, and business-oriented. Focus first on SELECT, WHERE, GROUP BY, and JOIN. These four operations cover the majority of business analysis queries. Practice on real data from your own organisation as soon as possible — abstract exercises embed more slowly than live business questions.
Skill 05
Critical Thinking with Data
Questioning sources, assumptions, and conclusions — not just accepting outputs
FoundationalAll RolesLeadership
In an environment where dashboards update in real time, AI tools generate instant analyses, and every function has access to self-service BI, critical thinking has never been more important — or more neglected. The barrier to producing a chart has dropped to zero. The barrier to producing a correct, contextually appropriate, and unbiased chart has not moved. Someone in every meeting needs to ask: where did this data come from? What does it exclude? Could this conclusion be explained another way?
MIT Sloan identifies this as the crucial distinction: true data literacy is not just reading data, it is thinking and acting differently as a result — understanding the real business problem and applying intelligent insights to solve the right problems, not just the ones that happen to have available data.
How to Build It
Develop a personal checklist of questions to ask whenever a data claim is presented: What is the source? What is the sample size? What time period? What is excluded? Could the same data support the opposite conclusion? Apply this in every review meeting for 30 days. It becomes instinctive faster than any formal training.
Skill 06
AI & Prompt Literacy
Using AI tools to accelerate analysis — without losing ownership of the output
Emerging EssentialAll Roles2026 Priority
AI literacy is now ranked alongside data literacy as a baseline workplace skill — 72% of enterprise leaders in DataCamp’s 2026 survey say AI literacy is important for day-to-day work. For business professionals, this doesn’t mean building AI models. It means knowing how to use AI tools effectively for analysis, how to write prompts that produce accurate and useful outputs, and critically — how to validate and question what those tools produce.
The organisations pairing AI investment with structured AI literacy programmes are nearly twice as likely to see significant ROI from AI tools. The gap is not in access to AI — it is in workforce fluency. A professional who can direct an AI tool precisely, validate its outputs critically, and integrate results into sound decisions is dramatically more productive than one who either avoids AI entirely or accepts its outputs uncritically.
How to Build It
Start by using AI tools for real analysis tasks in your current role — summarising reports, generating first-draft SQL queries, interpreting dashboards. Then practise validation: take every AI-generated output and check it against source data. The discipline of verification builds the fluency that separates capable AI users from reckless ones.
Skill 07
Data Storytelling
Turning insight into action by communicating data as narrative, not noise
High ImpactLeadershipStrategy
Technical skills get you the insight. Data storytelling determines whether anyone acts on it. Dataquest’s 2026 Skills Roadmap is direct on this point: technically brilliant work gets ignored constantly because it wasn’t communicated effectively. A simpler analysis presented clearly can drive millions in business value. Your technical skills get you in the door — your communication skills determine how far you go.
Data storytelling is the art of structuring an analytical finding as a narrative: here is the situation, here is what the data shows, here is what it means for the decision at hand. It involves choosing the right level of detail for the audience, leading with the conclusion rather than the methodology, and connecting numbers to business consequences that decision-makers actually care about.
How to Build It
For every analysis you present, write the “so what” before you build the slide. If you can’t state the business implication in one sentence, the analysis isn’t complete yet. Practice the SCR framework (Situation, Complication, Resolution) for structuring data presentations — it forces clarity in a way that open-ended slide-building does not.
Skill 08
Data Ethics & Privacy Awareness
Knowing what you can and can’t do with data — before regulators tell you
ComplianceAll RolesLeadership
Data ethics literacy has become a core professional requirement as regulatory frameworks tighten globally. Understanding the basics of GDPR, data minimisation principles, consent requirements, and the ethical implications of using data for automated decision-making is no longer the exclusive domain of legal and compliance teams. Every professional who works with customer or employee data needs to understand the boundaries of acceptable use.
Coursera’s 2026 data literacy guide explicitly identifies foundational data ethics as a component of organisational data literacy — the ability to comprehend the ethical implications of using data to drive decision-making. The reputational and financial consequences of ethics failures in data use have made this a board-level concern, and the expectation is that it filters down to every data-adjacent role.
How to Build It
Complete a foundational GDPR or data ethics course (Google’s “Responsible AI” module or Coursera’s data ethics offerings are free entry points). For every new data project, ask three questions: Is the data collected with appropriate consent? Could this analysis produce outcomes that unfairly disadvantage any group? Are we storing only what we need for only as long as we need it?
Skill 09
Business Context Fluency
Knowing which questions are worth answering — and why the numbers matter
StrategicLeadershipCross-Functional
Business context fluency is the skill that transforms a data analyst into a business partner. It is the ability to connect a data finding to a specific business decision, to understand which metrics matter for which strategic priorities, and to frame analysis in terms of the outcomes that leadership actually cares about. AI tools can process data. They cannot determine what questions matter to your business or its priorities — that judgment requires deep business context.
This is the skill Dataquest’s 2026 roadmap identifies as the one where the bar has risen fastest: the technical execution barrier has lowered (AI helps with syntax), but the business understanding and communication requirement has increased. You are not competing with people who know the most techniques — you are competing with people who solve business problems most effectively.
How to Build It
Before any analysis, write a one-sentence statement of the business decision this analysis will inform. After completing the analysis, write one sentence on what action it recommends. If you can do both, the analysis has business context. If you can’t, the analysis is a technical exercise rather than a business tool.
Skill 10
Communicating Data to Non-Technical Audiences
Translating complex findings into language that drives decisions at every level
AdvancedLeadershipHighest Impact
The most advanced data literacy skill is also the one with the most direct business impact: the ability to translate complex analytical findings into clear, compelling language for decision-makers who are not themselves data-literate. This is not about dumbing things down. It is about precision — finding the level of detail that enables good decisions without obscuring the important uncertainties or caveats that a non-technical audience might otherwise miss.
Coursera’s data literacy framework makes this explicit: true data literacy is the ability to communicate your data to everyone in your organisation. MIT Sloan’s research identifies this as the capstone skill that connects data capability to data culture — and data culture to actual business performance. The organisations that achieve genuine data-driven decision-making are those where this translation skill exists at every level of management, not just in the data team.
How to Build It
Practice the “grandmother test” for every data presentation: could a smart person with no technical background understand the key finding and the recommended action from this slide in 30 seconds? If not, the communication has failed — not the audience. Every jargon term is a decision to exclude someone from the room. Replace technical language with business language systematically.
Your Personal Data Literacy Assessment
Rate yourself honestly on each skill. Where you score lowest is where your career leverage is highest.
1 Data Interpretation: Can I read any report or dashboard and explain what each metric represents?
2 Statistical Thinking: Do I ask about sample size and significance before trusting a data conclusion?
3 Visualisation Literacy: Can I identify a misleading chart, and choose the right format for my own data?
4 SQL Basics: Can I write a query to retrieve and filter data from a database independently?
5 Critical Thinking: Do I routinely question data sources, exclusions, and alternative interpretations?
6 AI Literacy: Can I direct AI tools for analysis and validate what they produce critically?
7 Data Storytelling: Can I present a finding as a clear narrative with a business recommendation?
8 Data Ethics: Do I know the consent, privacy, and ethical boundaries of the data I work with?
9 Business Context: Can I always connect an analysis to the specific decision it informs?
10 Non-Technical Communication: Can any senior leader understand my analysis without a briefing?
The Bottom Line
Data and AI skills are now as fundamental to modern work as the ability to write. That is not a prediction — it is the direct conclusion of the 2026 State of Data & AI Literacy Report, drawn from 500+ enterprise leaders across the US and UK. The organisations that invest in building these skills systematically are faster to decide, more accurate in their decisions, and nearly twice as likely to generate meaningful ROI from their AI investments.
The good news is that the most important skills on this list are not the most technically demanding. Data interpretation, critical thinking, storytelling, and business context fluency are skills that every professional can build with deliberate practice — no data science degree required. The organisations that close the data literacy gap will not do it by hiring more data scientists. They will do it by developing every professional’s ability to work confidently with data in their own domain.
Start with the assessment above. Identify your lowest two scores. Build those first.
