Every business already has the raw material sitting in its systems — transactions, clicks, support tickets, inventory logs. The difference between a company that grows and one that stalls increasingly comes down to whether it turns that raw material into decisions. In 2026, that discipline is called data analytics, and it has become one of the fastest-growing corners of enterprise technology, with the global data analytics market projected to reach roughly $107 billion this year and expand toward $738 billion by 2033 at a compound annual growth rate above 31%.
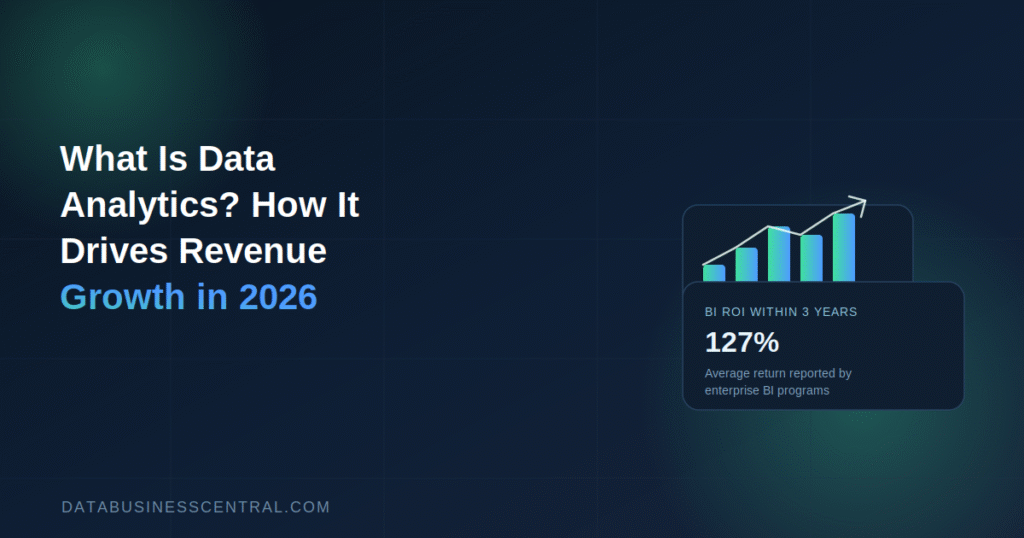
The payoff isn’t theoretical. Enterprise business intelligence programs report an average return on investment of 127% within three years, and companies that fail to act on their data pay a steep price — poor data quality alone drains an estimated 12% of annual revenue from the average organization. If you’re wondering what data analytics actually is, and more importantly, how businesses use data analytics to increase revenue, this guide breaks down both the fundamentals and the practical playbook.
What Is Data Analytics?
Data analytics is the process of examining raw data to uncover patterns, answer specific questions, and support better business decisions. It combines statistical methods, software tools, and increasingly AI to turn scattered numbers — sales records, website behavior, customer feedback — into something a team can actually act on. Rather than guessing why revenue dipped last quarter or which customers are about to churn, data analytics gives businesses a way to find the answer in the data itself.
At its core, data analytics answers four progressively harder questions: what happened, why it happened, what will happen next, and what should be done about it. Understanding those four categories is the first step to using analytics effectively.
The Four Types of Data Analytics
- Descriptive analytics looks backward, summarizing what already happened — monthly sales totals, website traffic, customer support volume. It’s the foundation every dashboard is built on.
- Diagnostic analytics digs into why something happened, comparing variables to find the root cause behind a spike in returns or a drop in conversions.
- Predictive analytics uses historical patterns and machine learning to forecast what’s likely to happen next, from next quarter’s demand to which customers are likely to churn.
- Prescriptive analytics goes a step further, recommending specific actions — which price to set, which customer to prioritize, which inventory to reorder — based on predicted outcomes.
Most mature organizations use all four together: descriptive and diagnostic analytics explain the past, while predictive and prescriptive analytics shape what happens next.
How Businesses Use Data Analytics to Increase Revenue in 2026
1. Personalizing the Customer Experience
Analytics lets businesses tailor product recommendations, email content, and offers to individual customer behavior instead of broadcasting the same message to everyone. That precision pays off directly — personalized marketing driven by data analytics has been shown to lift revenue by 10% to 30% depending on the industry and execution quality. E-commerce and streaming platforms have led the way here, but retailers, banks, and healthcare providers are catching up fast as customer data becomes easier to unify.
2. Optimizing Pricing in Real Time
Dynamic pricing models, once limited to airlines and hotels, now run across retail, ride-sharing, and even B2B software pricing. By analyzing demand signals, competitor pricing, and inventory levels continuously, businesses can adjust prices to capture more revenue without manually reviewing every product line. Companies using real-time analytics for decisions like this are roughly three times more likely to outperform competitors who still rely on quarterly pricing reviews.
3. Reducing Customer Churn Before It Happens
Predictive analytics can flag customers showing early warning signs of churn — reduced usage, support complaints, delayed payments — well before they cancel. That early warning gives sales and customer success teams a window to intervene with a targeted offer or outreach, turning a customer that was about to leave into one that renews. Since retaining an existing customer is almost always cheaper than acquiring a new one, churn prediction has become one of the highest-ROI analytics use cases available.
4. Forecasting Demand and Optimizing Inventory
Retailers and manufacturers use predictive analytics to forecast demand at the SKU level, reducing both stockouts that lose sales and excess inventory that ties up cash. Getting this right directly protects revenue on both ends — a stockout is a lost sale, and overstock is capital sitting idle on a shelf. As supply chains have grown more complex and volatile, demand forecasting has shifted from a nice-to-have to a core competitive requirement.
5. Improving Sales Forecasting and Pipeline Prioritization
Sales teams increasingly rely on predictive scoring to identify which leads are most likely to close, letting reps focus their limited time on the highest-probability opportunities instead of spreading effort evenly across the pipeline. Combined with historical win-rate data, this kind of analytics turns sales forecasting from a gut-feeling exercise into a data-backed process that finance can actually plan around.
6. Building New, Data-Driven Revenue Streams
Beyond optimizing existing operations, some companies are monetizing their data directly — packaging aggregated, anonymized insights into new products or services sold to partners and customers. Financial institutions, logistics companies, and healthcare providers have all found ways to turn internal analytics capabilities into standalone revenue lines, not just internal efficiency tools.
Getting Started: A Practical Path to Data-Driven Revenue
Businesses that succeed with analytics rarely start by buying the most advanced platform on the market. They start with a clear question and work backward:
- Pick one high-impact business question — like churn, pricing, or demand forecasting — rather than trying to analyze everything at once.
- Audit your existing data quality before investing in advanced tools; garbage data produces garbage predictions no matter how sophisticated the model.
- Choose tools that match your team’s skill level, whether that’s a self-service BI tool or a full data science platform.
- Assign clear ownership for turning insights into action — a dashboard nobody acts on delivers zero revenue impact.
- Track ROI explicitly, since more than half of data teams currently don’t formally measure whether their analytics work actually moves business outcomes.
Common Pitfalls to Avoid
Even well-funded analytics initiatives stall for predictable reasons: fragmented data spread across disconnected systems, a shortage of skilled analysts to interpret results, and dashboards that generate insight nobody actually implements. The businesses that see real revenue impact treat data analytics as a decision-making discipline tied to specific outcomes, not a reporting exercise measured by how many charts get built.
Final Thoughts
Data analytics isn’t a single tool or a department — it’s the practice of letting evidence, not assumptions, drive business decisions. The businesses pulling ahead in 2026 aren’t necessarily the ones with the most data; they’re the ones that turned descriptive dashboards into predictive forecasts and prescriptive actions that directly move revenue. Whether that means personalizing offers, catching churn early, or pricing dynamically, the path from raw data to real growth is shorter than most businesses assume — it just requires starting with the right question.
Frequently Asked Questions
What’s the difference between data analytics and business intelligence? Business intelligence typically focuses on descriptive reporting of what already happened, while data analytics is the broader discipline that also includes predictive and prescriptive methods for forecasting and recommending action.
How quickly can a business see revenue results from data analytics? Enterprise BI programs report an average ROI of 127% within three years, though smaller, well-scoped projects like churn prediction or pricing optimization can show measurable impact within months.
Do small businesses need data analytics, or is it just for large enterprises? Small businesses can benefit just as much, often starting with simpler tools focused on one clear question, like customer retention or inventory turnover, rather than enterprise-scale platforms.
