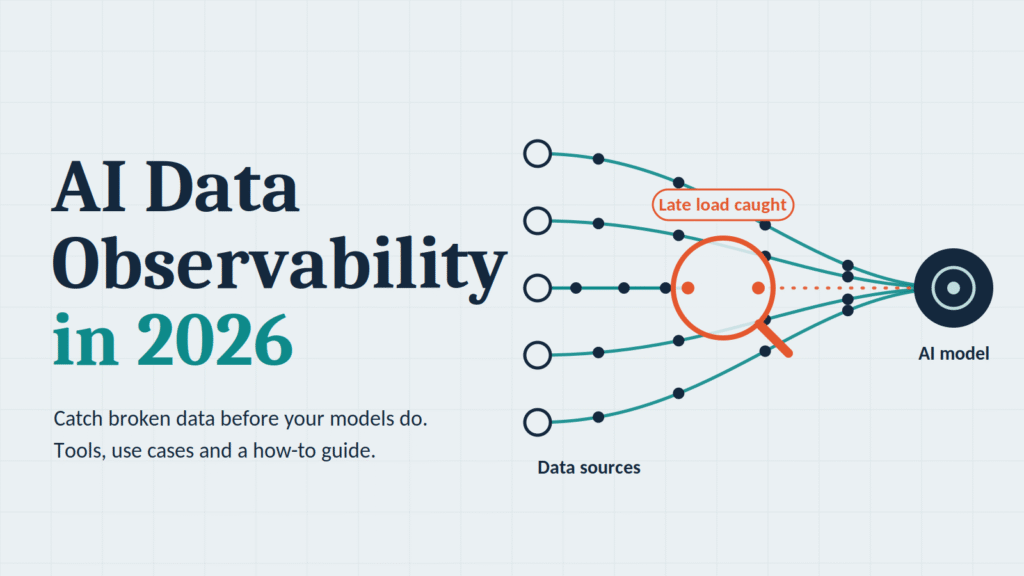
Your dashboard says revenue dropped 18% overnight. Your churn model suddenly flags half your best customers as “at risk.” Your AI assistant confidently quotes a pricing policy that was retired six months ago.
None of these are model problems. They are data problems. And in most companies, nobody finds out until a customer, an executive, or a regulator points it out.
That is the gap AI data observability closes. As more business decisions run through machine learning models, retrieval systems, and autonomous agents, the quality of the data feeding them has become the single biggest factor in whether AI works or quietly fails.
This guide explains what AI data observability is, why it matters in 2026, how the leading data observability tools compare, where it pays off, and how to implement it without drowning your team in alerts.
What Is AI Data Observability?
AI data observability is the practice of continuously monitoring, tracing, and understanding the health of the data that powers your analytics and AI systems, from the moment data is created to the moment a model or user consumes it.
It answers five practical questions:
- Is my data fresh, complete, and accurate right now?
- If something broke, where did it break?
- Who and what is affected downstream?
- Why did it happen?
- How do we stop it from happening again?
The word “AI” in the name carries two meanings, and both matter:
- Observability for AI: monitoring the data that trains, grounds, and feeds AI systems, including training sets, feature stores, vector databases, and retrieval corpora.
- Observability powered by AI: using machine learning to detect anomalies, learn what “normal” looks like, and prioritize issues without hand-written rules for every table.
Modern platforms do both. They learn the normal rhythm of your data, flag deviations, and trace the root cause across the pipeline.
How It Differs from Traditional Data Monitoring
Traditional monitoring asks, “Did the job run?” Observability asks, “Is the data the job produced actually right, and what depends on it?”
| Aspect | Traditional monitoring | AI data observability |
|---|---|---|
| Focus | Job success or failure | Data health and behavior |
| Detection | Static rules and thresholds | Learned baselines and anomaly detection |
| Scope | Single tool or pipeline | End to end across the stack |
| Root cause | Manual investigation | Lineage-assisted, often automated |
| Impact analysis | Rarely available | Downstream dashboards, models, and apps |
| AI coverage | Minimal | Features, embeddings, RAG corpora, LLM inputs |
A pipeline can finish successfully and still deliver garbage. Observability catches the second problem, not just the first.
Why AI Data Observability Matters in 2026
Three shifts have turned this from a nice-to-have into core infrastructure.
1. AI has moved into production
A few years ago, most AI was experimental. Now models approve loans, route support tickets, personalize pricing, and draft customer communications. When these systems consume bad data, the damage is immediate and visible. A stale feature or a broken join can produce thousands of wrong decisions before anyone notices.
2. Data estates are more complex
The average enterprise now runs multiple warehouses or lakehouses, streaming systems, SaaS sources, transformation layers, vector stores, and orchestration tools. More moving parts means more places for silent failure. Manual checks cannot keep pace.
3. Agents and RAG raise the stakes
Retrieval-augmented generation and AI agents depend on documents, knowledge bases, and tool outputs that change constantly. If your knowledge base contains outdated policies, duplicate documents, or broken chunking, your AI will answer wrongly with total confidence. Unlike a dashboard, an LLM does not look “broken.” It just sounds right while being wrong.
The business cost of getting it wrong
Poor data quality quietly drains money through bad decisions, rework, failed AI projects, compliance exposure, and lost trust. Analyst firms have long estimated that bad data costs organizations millions of dollars a year on average. Whatever the exact figure for your company, the pattern is consistent: the later you catch a data issue, the more expensive it is.
Observability moves detection from “a customer complained” to “we fixed it before anyone noticed.”
The Five Pillars of Data Observability
Most frameworks organize data observability around five pillars. They give you a shared vocabulary for what to monitor.
Freshness
Is the data up to date? A table that normally updates every hour but hasn’t changed in six is a red flag. Freshness is the most common source of silent AI failure, especially for real-time features and retrieval systems.
Volume
Did the expected amount of data arrive? A sudden drop in row counts often signals a broken upstream extract. A sudden spike may indicate duplicates or a runaway process.
Schema
Did the structure change? Added, removed, renamed, or retyped columns can break transformations, dashboards, and model inputs without throwing an obvious error.
Distribution
Do the values still look right? Distribution monitoring checks ranges, null rates, uniqueness, and statistical shape. This is where data quality monitoring meets machine learning, because drift in feature distributions is a leading cause of model degradation.
Lineage
Where did this data come from, and what depends on it? Lineage connects sources, transformations, tables, dashboards, and models into one map. It turns “something is wrong” into “this upstream change broke these five downstream assets.”
Strong tools add a sixth layer for AI workloads: semantic and content quality, such as checking embeddings, document freshness, duplicate chunks, and PII in text.
Observability for AI Data Pipelines
AI data pipelines differ from classic analytics pipelines in ways that matter for monitoring. Here is what to watch at each stage.
Training and fine-tuning data
- Label quality: inconsistent or noisy labels degrade models in ways that are hard to diagnose later.
- Class balance and coverage: a dataset that quietly loses a customer segment produces a model that fails on that segment.
- Leakage: features that accidentally contain information from the future inflate offline metrics and fail in production.
- Dataset versioning: you need to know exactly which data produced which model.
Feature pipelines and feature stores
- Training-serving skew: features computed differently offline and online are a classic source of production bugs.
- Freshness and latency: real-time models are only as good as their newest feature.
- Drift: monitor feature distributions against training baselines.
RAG and vector pipelines
- Source freshness: are the documents behind your answers current?
- Ingestion health: are all documents being chunked, embedded, and indexed?
- Duplicates and conflicts: two versions of the same policy lead to contradictory answers.
- Sensitive data: personal or confidential information sitting in a retrieval corpus is a compliance incident waiting to happen.
- Embedding drift: changing embedding models or chunking logic can silently alter retrieval quality.
Agent inputs and tool outputs
Agents call APIs, query databases, and read files. Observability here means validating that tool outputs are well formed, within expected ranges, and traceable back to a source, so you can explain why an agent took an action.
Model inputs and outputs
Even though this edges into model monitoring, the data side matters: unusual input patterns, missing fields at inference time, and shifts in prediction distributions are often the first visible symptom of an upstream data problem.
Key Capabilities to Look For
When evaluating data observability tools, these capabilities separate serious platforms from basic monitors.
Broad connectivity. The tool should integrate with your warehouse or lakehouse, orchestrator, transformation layer, BI tools, and ideally your vector databases and ML platforms.
Automated anomaly detection. Look for learned baselines that account for seasonality, so you are not writing hundreds of rules by hand or drowning in false positives.
Column-level lineage. Table-level lineage is helpful. Column-level lineage is what makes root cause analysis and impact analysis fast.
Custom rules and data contracts. Machine learning catches the unknown. Explicit checks and contracts protect what you already know matters.
Incident management. Alert routing, ownership assignment, status tracking, and integration with Slack, Teams, PagerDuty, or Jira keep issues from getting lost.
Alert quality controls. Grouping, deduplication, severity scoring, and tuning options decide whether the tool gets adopted or muted.
Cost and performance awareness. Observability queries consume compute. Good tools use metadata and sampling smartly so monitoring does not blow up your warehouse bill.
Security and governance. Role-based access, in-VPC or metadata-only options, audit logs, and PII detection matter in regulated industries.
AI-specific coverage. Support for unstructured data, embeddings, and LLM pipeline inputs is increasingly a differentiator.
Data Observability Tools Compared (2026)
The market includes dedicated platforms, open-source frameworks, and observability features bundled into larger data or infrastructure suites. The comparison below is a starting point. Features and packaging change quickly, so verify current capabilities with each vendor before you decide.
| Tool | Type | Best for | Notable strengths |
|---|---|---|---|
| Monte Carlo | Dedicated platform | Large enterprises with complex stacks | Mature end-to-end observability, lineage, incident workflows |
| Bigeye | Dedicated platform | Teams wanting strong metrics and lineage-driven monitoring | Automated monitoring, enterprise governance focus |
| Acceldata | Dedicated platform | Hybrid and large-scale data estates | Pipeline, quality, and cost-oriented observability |
| Anomalo | Dedicated platform | ML-driven quality monitoring, including unstructured data | Automated detection with minimal rule writing |
| Sifflet | Dedicated platform | Teams that want observability tied to catalog and business context | Lineage, collaboration, business-friendly interface |
| Soda | Open core and platform | Teams that like checks-as-code and data contracts | Flexible check language, developer-friendly |
| Great Expectations | Open source and commercial | Engineers wanting explicit, testable expectations | Highly customizable validation framework |
| Elementary | Open source | dbt-centric teams | Lightweight, dbt-native monitoring |
| Metaplane (Datadog) | Platform within a broader suite | Teams already using Datadog | Easy setup, tied into broader observability |
| Databricks and Snowflake native features | Platform-native | Teams committed to one platform | Tight integration, lower friction |
Quick profiles
Monte Carlo is often the first name in the category. It focuses on automated detection across freshness, volume, and schema, with lineage that helps trace incidents to their source. It tends to suit larger organizations that want a comprehensive, managed experience.
Bigeye emphasizes automated metric monitoring and lineage-informed workflows, and has leaned into enterprise governance and AI readiness.
Acceldata positions itself around observability across data, pipelines, and cost, which appeals to organizations with large, hybrid environments.
Anomalo stands out for machine-learning-first detection that requires little manual configuration, with growing support for unstructured data relevant to AI use cases.
Sifflet pairs observability with catalog and business context, which helps bridge technical teams and data consumers.
Soda and Great Expectations take a code-first approach. If your engineers want to define checks and contracts in version control and run them in CI, these are strong fits. The trade-off is that you do more of the setup yourself.
Elementary is a pragmatic pick for teams whose transformation layer is dbt and who want visibility without adopting a heavy platform.
Metaplane joined the Datadog family, which makes it attractive if your infrastructure and application teams already live in Datadog and you want data and system health in one place.
Platform-native features from Databricks, Snowflake, and others are worth evaluating first. If your stack lives mostly in one platform, built-in monitoring may cover 70 to 80 percent of your needs at lower cost and complexity.
How to choose
Ask these questions in order:
- What is our stack? Choose tools with deep integrations for your warehouse, orchestrator, and BI layer.
- Who will own it? Engineering-led teams may prefer code-first tools. Data-platform teams serving many business users often prefer managed platforms.
- How big is the problem? A startup with fifty tables does not need what a bank with fifty thousand does.
- Do we need AI-specific coverage? If RAG, embeddings, or unstructured data are central, test those capabilities specifically.
- What is our budget model? Compare pricing by tables, volume, users, or compute, and estimate your real costs at scale.
Run a proof of concept on your own data with two or three finalists. Demo environments always look good. Your messy production data is the real test.
High-Impact Use Cases
1. Protecting executive dashboards and financial reporting
When a metric on a board deck is wrong, trust in the entire data team erodes. Observability catches broken pipelines, delayed loads, and unexpected shifts before the numbers reach leadership.
Example: A currency conversion table fails to refresh. Revenue in one region is overstated by 12 percent. Freshness monitoring flags the stale table within minutes, and lineage shows which reports were affected.
2. Keeping ML models healthy
Models degrade when their input data changes. Observability detects feature drift, null spikes, and training-serving skew before accuracy falls.
Example: A fraud model starts missing cases after an upstream team changes how device IDs are formatted. Distribution monitoring catches the change on day one rather than after a quarter of losses.
3. Making RAG and AI assistants trustworthy
Monitor knowledge base freshness, ingestion failures, duplicate documents, and sensitive content so your AI answers from current, correct, permitted sources.
Example: A support chatbot cites an outdated refund policy. Observability on the document pipeline shows that the new policy PDF failed to ingest. Alerts now catch ingestion failures immediately.
4. Supporting regulatory compliance and audit readiness
Lineage and quality records give you evidence of where data came from, how it was transformed, and what controls were applied. This is valuable under privacy regulations, financial reporting rules, and emerging AI governance requirements.
5. Controlling data and cloud costs
Observability surfaces unused tables, runaway queries, duplicated pipelines, and expensive jobs that produce data nobody consumes. Teams often recover meaningful savings simply by retiring what lineage shows is unused.
6. Accelerating migrations and platform changes
When moving warehouses or refactoring pipelines, observability lets you compare old and new outputs, detect regressions, and migrate with confidence.
7. Enabling data products and data contracts
When teams publish data as a product, observability enforces the promises: freshness SLAs, schema stability, and quality thresholds. Consumers know what to expect, and producers know when they have broken the contract.
A Step-by-Step Implementation Guide
Rolling out observability everywhere at once is the fastest route to alert fatigue and abandonment. Start narrow, prove value, then expand.
Step 1: Define what matters most
List your critical data assets: the tables behind key dashboards, the features behind production models, and the corpora behind AI assistants. Rank them by business impact. A useful question is, “If this were wrong for 24 hours, what would it cost us?”
Aim for a first scope of 20 to 50 high-value assets, not your entire warehouse.
Step 2: Map ownership
Every critical asset needs an owner. Without one, alerts go nowhere. Document who is responsible for the source, the transformation, and the consumption, and decide who gets paged for what.
Step 3: Establish baselines and SLAs
Define what “healthy” means. For each critical asset, set expectations for freshness, volume, schema stability, and key quality rules. Let automated tools learn baselines, then review and adjust them with domain experts.
Step 4: Choose and connect your tooling
Select a tool based on the criteria above and connect it to your core systems: warehouse or lakehouse, orchestrator, transformation layer, BI, and ML platform. Start with metadata-level monitoring, which is cheap and fast, then add deeper checks where needed.
Step 5: Turn on automated monitoring, then add targeted rules
Begin with automated anomaly detection for freshness, volume, and schema across your scoped assets. Layer on custom rules for business logic the machine cannot know, such as “order total must never be negative” or “every customer must have a valid region.”
Step 6: Build alert workflows that people will trust
This is where most programs succeed or fail.
- Route alerts to the owning team’s channel, not a shared firehose.
- Assign severity so critical issues stand out.
- Group related alerts into a single incident.
- Include context: what changed, what is affected, and a link to lineage.
- Review and tune weekly during the first two months.
If people start ignoring alerts, your program is already failing. Treat false positives as bugs.
Step 7: Use lineage for incident response
Create a simple playbook: when an alert fires, check lineage upstream for the root cause, check downstream for the impact, notify affected consumers, fix, and document. Over time, this playbook shrinks resolution time dramatically.
Step 8: Extend to AI-specific pipelines
Once core monitoring is stable, add coverage for your AI workloads: feature drift, training data checks, RAG ingestion monitoring, embedding pipeline health, and PII detection in text sources.
Step 9: Shift left with CI/CD and data contracts
Catch problems before they reach production. Run data tests in pull requests, validate schema changes against downstream dependencies, and formalize contracts between producers and consumers.
Step 10: Measure and report
Track outcomes so you can justify the investment and focus improvement:
- Time to detect (TTD): how quickly you notice an issue.
- Time to resolve (TTR): how quickly you fix it.
- Number of data incidents: by severity and by source.
- Percentage of critical assets covered: your monitoring coverage.
- Alert precision: what share of alerts are real problems.
- Consumer-reported issues: the share of incidents found by users rather than monitoring. This should fall steadily.
Build vs. Buy
Build when you have a small, well-understood stack, strong engineering capacity, and mainly need explicit validation tests. Open-source frameworks plus your existing orchestration and alerting can go a long way.
Buy when your environment is large or fast-changing, when you need automated detection across thousands of tables, when lineage and incident management matter, or when your team cannot afford to maintain internal tooling.
Combine when it makes sense. Many mature teams use open-source checks for known rules inside their transformation layer and a platform for automated anomaly detection and lineage across everything else.
Be honest about hidden costs. Building looks cheaper until you account for maintenance, tuning, and the engineers who could be doing other work. Buying looks easy until you discover integration gaps or pricing that scales faster than your budget.
Common Mistakes to Avoid
Monitoring everything on day one. More coverage does not mean more value. It means more noise. Start with what matters.
Ignoring ownership. An alert without an owner is just a notification nobody reads.
Relying only on machine learning detection. Learned baselines catch unknown unknowns, but business rules protect what you already know is critical. Use both.
Treating it as a tooling project. Observability is a practice involving people, process, and accountability. The best tool will not fix a culture where nobody owns data quality.
Forgetting unstructured data. If your AI depends on documents, emails, tickets, or transcripts, structured-only monitoring leaves your biggest risk uncovered.
Skipping the feedback loop. Every incident should lead to a prevention step: a new check, a contract, or a process fix. Otherwise you keep fighting the same fires.
Neglecting cost. Monitoring queries run on your compute. Use metadata and sampling wisely, and watch your bill.
Trends Shaping AI Data Observability
Convergence of observability and governance. Quality, lineage, cataloging, and access policies are blending into unified platforms, because trust in data depends on all of them together.
Observability for unstructured and vector data. As RAG and agents spread, expect deeper support for document quality, embedding health, and retrieval performance.
AI-assisted root cause analysis. Tools increasingly use AI agents to investigate incidents, summarize likely causes, and even propose fixes, reducing the time humans spend digging.
Data contracts going mainstream. More organizations are formalizing producer-consumer agreements and enforcing them automatically.
Closer ties with model and LLM observability. The line between data observability and ML observability is blurring. Teams want one view from source data through to model behavior and user outcomes.
Platform consolidation. Larger infrastructure and data vendors continue to absorb or build observability capabilities, which gives teams more bundled options but makes it important to compare depth, not just checkboxes.
Greater regulatory pressure. Emerging AI regulations emphasize data governance, documentation, and traceability, making observability evidence increasingly valuable.
Frequently Asked Questions
What is AI data observability in simple terms?
It is continuous monitoring of the health of the data that feeds your analytics and AI systems. It detects problems like stale, missing, or unusual data, traces them to their source, and shows what they affect, so teams can fix issues before they cause wrong decisions.
How is data observability different from data quality monitoring?
Data quality monitoring checks whether data meets defined standards, such as completeness, validity, and uniqueness. Data observability is broader. It includes quality checks but also covers pipeline health, lineage, impact analysis, and root cause investigation. Quality monitoring tells you something is wrong. Observability helps you understand why and what to do about it.
Do I need a dedicated tool?
Not always. Small teams with simple stacks can begin with open-source checks and platform-native features. As complexity, data volume, and AI usage grow, dedicated data observability tools usually pay for themselves through faster detection and resolution.
How long does implementation take?
Connecting a tool and getting initial monitoring on critical assets can take days to a few weeks. Building mature alert workflows, ownership, contracts, and AI-specific coverage typically takes a few months of iteration.
What should I monitor first?
Start with the assets behind your most important dashboards, production models, and customer-facing AI features. Cover freshness, volume, and schema first. Add distribution checks and custom rules next.
Does observability help with LLM hallucinations?
Indirectly, yes. Many hallucination-like failures trace back to stale, missing, conflicting, or poorly chunked source data. Monitoring the data pipelines behind RAG systems reduces a major class of wrong answers, though it does not replace model evaluation and guardrails.
How do I prove ROI?
Track time to detect, time to resolve, incident counts, and the share of issues found by users instead of monitoring. Combine those with estimated cost per incident, such as engineering hours, bad decisions avoided, and downtime, to show impact.
Conclusion
AI is only as reliable as the data beneath it. As companies move from AI experiments to AI in production, the cost of silent data failures rises sharply, and traditional monitoring is no longer enough.
AI data observability gives you continuous visibility into freshness, volume, schema, distribution, and lineage, extended to the pipelines, features, and retrieval corpora that power modern AI. Done well, it shifts your team from reactive firefighting to proactive prevention.
The path forward is simple, even if the work is not:
- Identify your most critical data assets.
- Assign clear owners.
- Start with automated monitoring and a few targeted rules.
- Build alert workflows people trust.
- Use lineage to resolve incidents faster.
- Extend coverage to your AI pipelines.
- Measure results and keep improving.
Start small, prove value, and expand. The teams that do this well are not the ones with the most dashboards. They are the ones whose data, and the AI built on it, people can trust.
