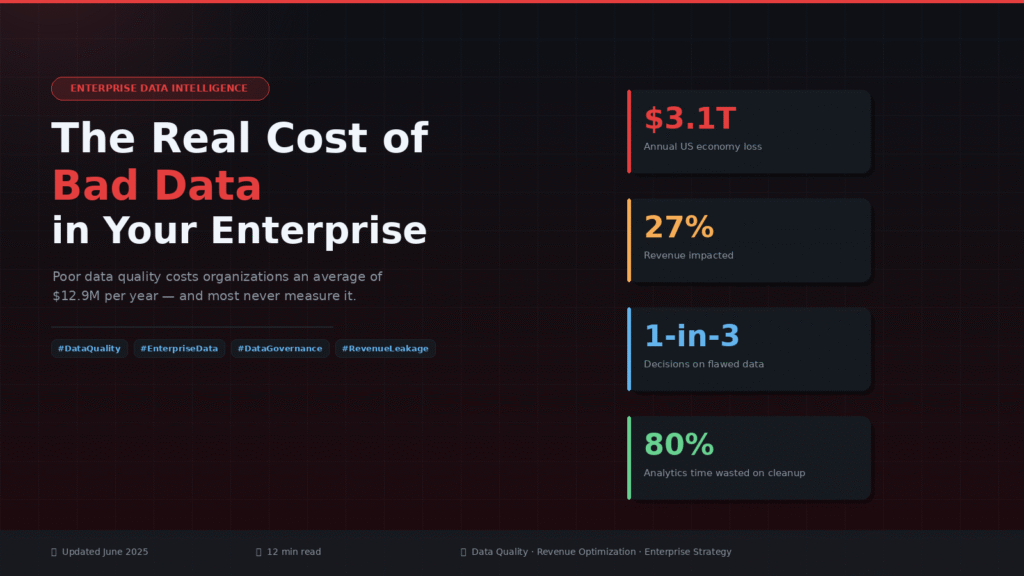
What your executives don’t know about data errors is costing you millions — and the damage compounds every quarter.
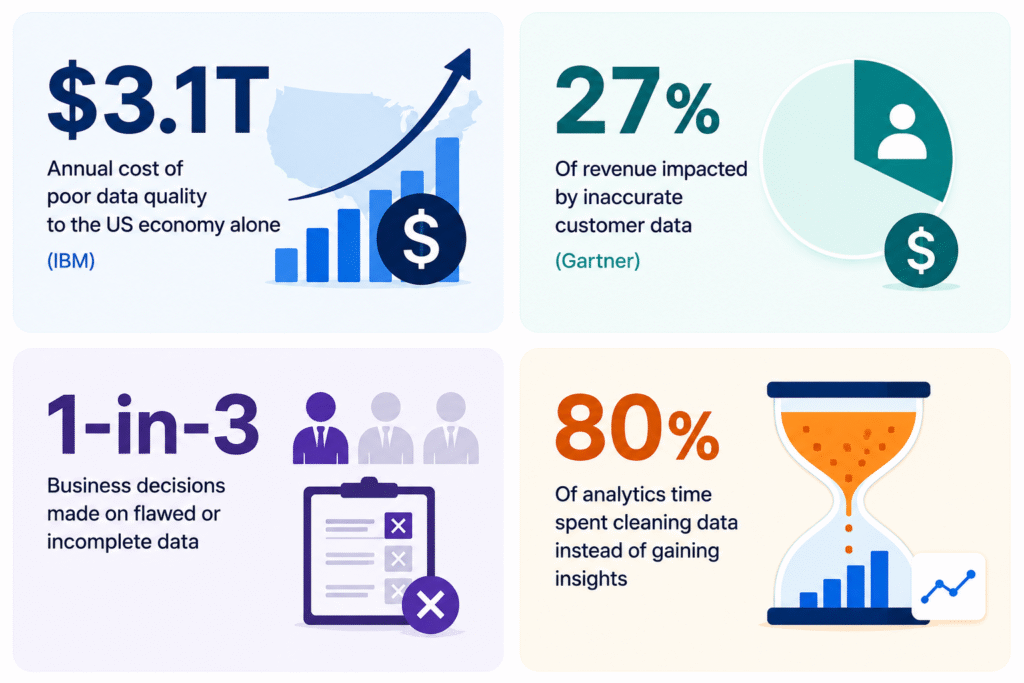
Every enterprise generates data. But not every enterprise trusts it. According to IBM’s research, organizations lose an average of $12.9 million every single year to poor data quality — and most of the time, nobody is even measuring it. Bad data doesn’t announce itself. It hides inside CRM fields, finance reports, marketing dashboards, and supply chain systems, quietly distorting every decision made from it.
This article breaks down precisely where poor data quality bleeds revenue, what causes it at the systemic level, how to measure its true cost across your enterprise, and — most critically — how to build a sustainable data quality strategy that actually delivers measurable ROI.
What We Mean by “Bad Data” — and Why It’s Bigger Than You Think
“Bad data” is an umbrella term covering a wide spectrum of data defects. It is not just a typo in a customer’s last name. It is systemic, pervasive, and often invisible until a consequential failure makes it visible.
| Defect Type | Example | Business Risk |
|---|---|---|
| Inaccurate Data | Wrong billing address in CRM | Failed delivery, customer churn |
| Incomplete Data | Missing industry field in lead records | Misrouted sales, lost deals |
| Duplicate Records | Same customer entered 3× under slight name variants | Wasted outreach, inflated metrics |
| Stale / Outdated Data | Contact still showing old job title from 2019 | Irrelevant messaging, broken relationships |
| Inconsistent Formats | Phone numbers as “555-1234” vs “5551234” vs “+15551234” | Broken integrations, failed analytics joins |
| Orphaned / Unlinked Data | Transaction records with no matching customer ID | Revenue leakage, compliance gaps |
“Data quality is not a technical problem. It is a business problem that sits inside technical systems. And like most silent business problems, it’s most expensive when it goes longest unmeasured.”—
Data governance principle, widely cited across enterprise analytics literature
How Much Is Bad Data Costing Your Enterprise?
The cost of poor data quality scales non-linearly with company size — and it’s rarely concentrated in one area. It spreads across operations, marketing, sales, compliance, and customer success simultaneously.
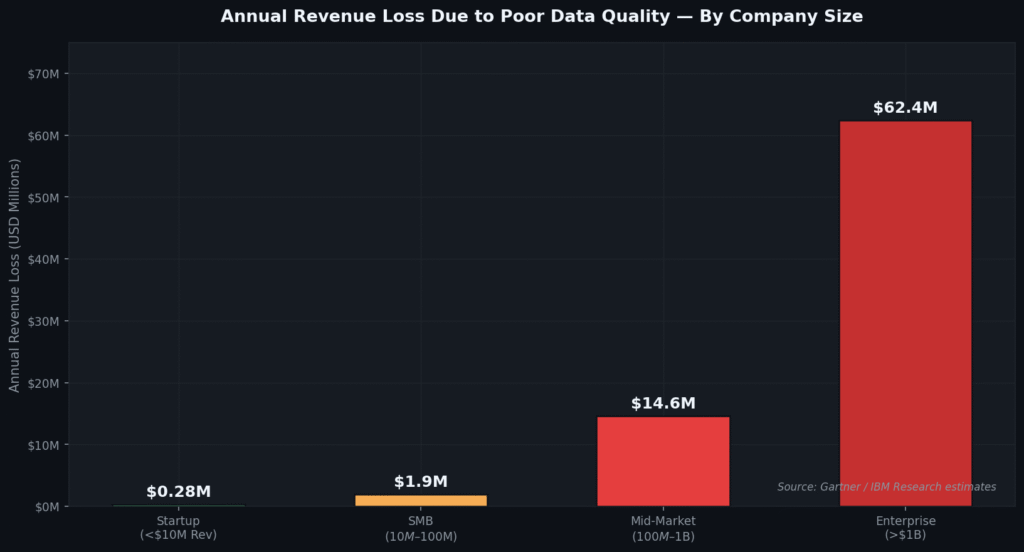
Fig 1. Annual estimated revenue loss attributable to poor data quality, segmented by company revenue tier. Source: Composite estimates from Gartner, IBM, and Forrester research.
For enterprises generating more than $1 billion in annual revenue, bad data losses routinely exceed $60M per year. Even mid-market companies in the $100M–$1B range are losing an estimated $14.6 million annually — enough to fund a full data engineering team several times over.
The Hidden Multiplier: Indirect Costs
Most organizations measure only the direct cost of fixing data: deduplication tools, manual correction hours, re-running reports. But the indirect costs — poor decisions made from bad data, customer relationships lost, regulatory fines incurred — are typically 3 to 5 times larger than the direct remediation costs.
⚠ The Hidden Cost Trap
When organizations try to calculate the cost of bad data, they usually only count data correction labor. That number alone still exceeds most data quality investment budgets. But it represents less than 25% of the true total cost. The other 75% — bad decisions, missed revenue, broken customer trust — rarely appears on any report.
Root Causes: Why Enterprises Produce Bad Data
Before fixing bad data, leadership needs an honest reckoning with where it originates. The root causes are rarely what teams assume — most enterprises blame individual human error, but the data tells a more systemic story.
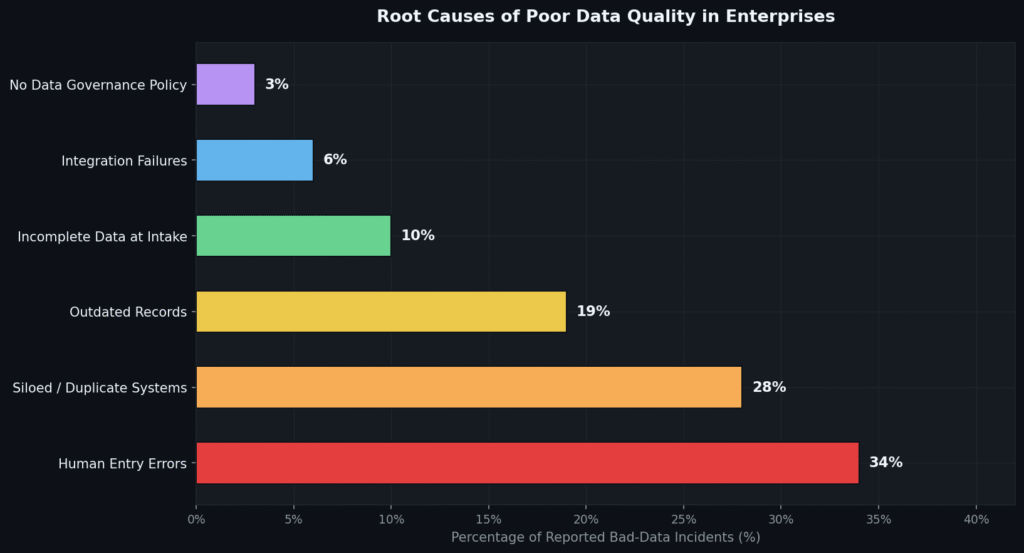
Fig 2. Distribution of root causes across 400+ enterprise data quality incidents. Human entry errors lead, but systemic issues (duplicate systems + outdated records) collectively account for nearly half of all incidents.
- 1Human Entry Errors (34%)Manual data entry remains the single largest source of bad data. Without validation rules, field constraints, or real-time error checking, human error compounds at the rate of every new record entered.
- 2Siloed and Duplicate Systems (28%)Most enterprises have 5–15 systems holding overlapping data — CRM, ERP, marketing automation, support ticketing, finance. Without a master data strategy, each system drifts independently, creating contradictory records.
- 3Outdated and Stale Records (19%)Data has a decay rate. Contact data decays at roughly 30% per year. Without systematic refresh processes, what was accurate in 2022 is actively harmful in 2025.
- 4Incomplete Data at Point of Intake (10%)Forms, APIs, and intake flows that allow blank required fields create structural incompleteness baked into the very foundation of your database. Fixing these records later costs 10× more than capturing them correctly upfront.
Business Impact: What Bad Data Actually Damages
Poor data quality doesn’t impact just one business function — it radiates across every team that touches data. The following radar diagram visualizes the severity of impact across six key business domains, rated on a composite severity score derived from cost, frequency, and recovery time.
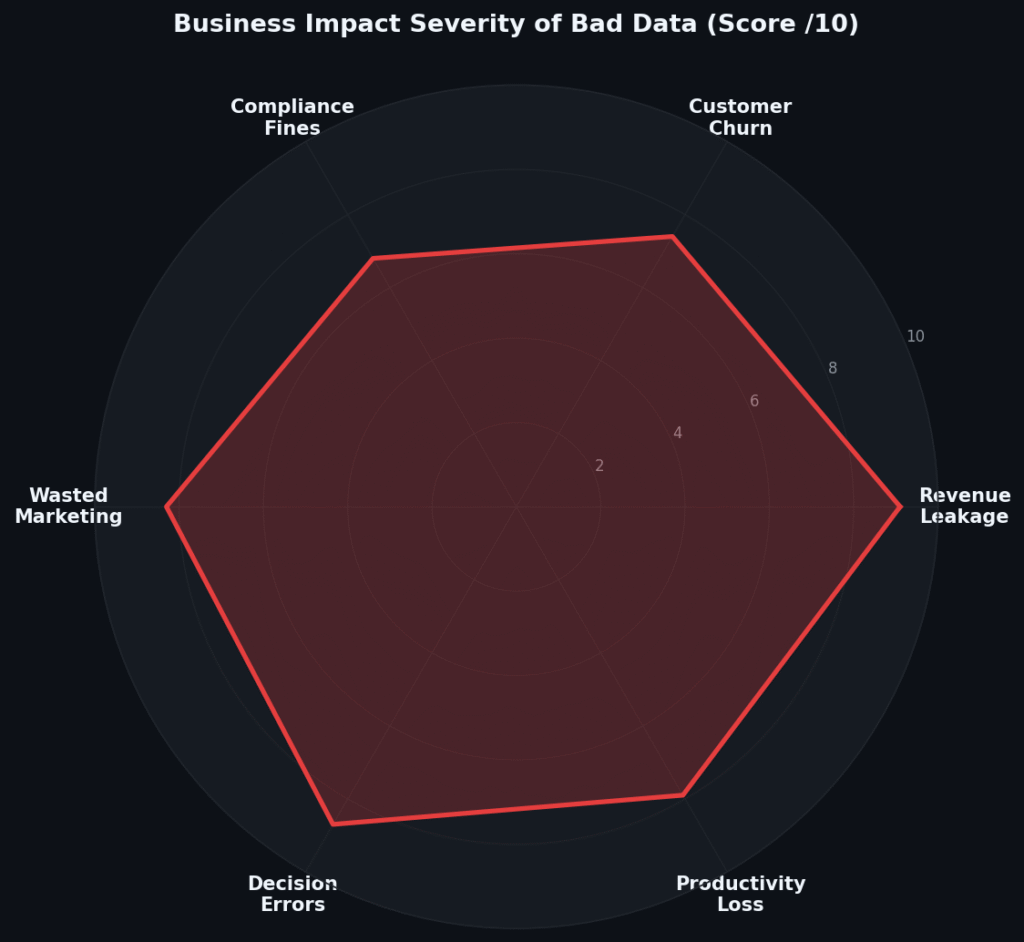
Fig 3. Business impact severity of poor data quality across six enterprise domains (composite score out of 10). Revenue leakage and decision-making errors rank highest, making data quality a C-suite issue, not just an IT concern.
Revenue Leakage: The Highest-Severity Impact
Revenue leakage from bad data takes multiple forms: invoices sent to wrong addresses, renewal triggers misfiring, cross-sell signals missed because accounts are duplicated. Each represents real money that was earned but never collected — or opportunities that existed but were never surfaced.
Decision-Making Errors: The Most Expensive Category
A senior executive makes a $5M budget allocation based on a market size report built on data that hasn’t been refreshed in 18 months. A product team prioritizes the wrong feature because engagement data was tracked inconsistently across platforms. Decision errors cascade: one bad data point at the strategic level can misalign an entire organization for a quarter or more.
Marketing Waste: The Most Measurable Drain
Organizations with poor CRM data routinely waste 20–30% of their digital marketing budget reaching the wrong audience, wrong persona, or even the same contact multiple times. With the average enterprise spending $15M–$50M annually on marketing, that’s $3M–$15M burned — directly traceable to data quality failures.
The Rule of Ten: Why Fixing Bad Data Early Is 100× Cheaper
The Rule of Ten (also known as the 1-10-100 rule in quality management) describes how the cost of fixing a data error multiplies at every subsequent stage of the data pipeline. A mistake caught at entry costs $1 to fix. The same mistake caught after it has influenced a business decision can cost $100 or more.
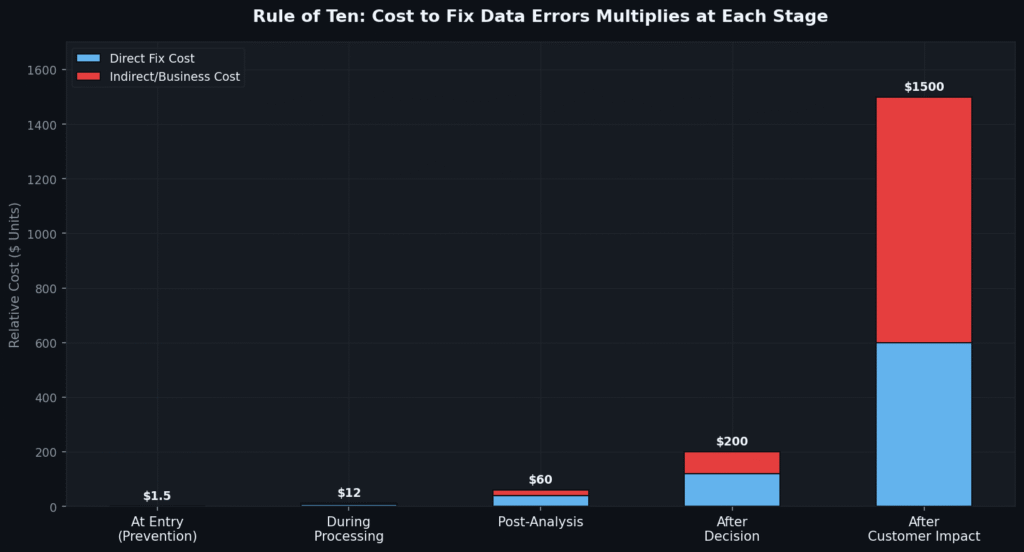
Fig 4. The Rule of Ten in practice. Each stage downstream multiplies fix cost by approximately 10×. Errors discovered after customer impact cost up to 1,500× more than errors caught at intake.
💡 Key Takeaway
The Rule of Ten reframes data quality investment as prevention, not cleanup. Every dollar spent on data validation at entry — form controls, API contracts, intake audits — eliminates $100–$1,500 in downstream remediation. This is the single most powerful financial argument for proactive data quality governance.
Sector-Specific Consequences: Where Bad Data Hits Hardest
The cost and nature of data quality failures varies by industry, but no sector is immune. Understanding the sector-specific risk profile of your organization helps prioritize where to invest first.
| Industry | Primary Risk from Bad Data | Estimated Annual Cost per Organization |
|---|---|---|
| Financial Services | Regulatory non-compliance, fraud detection failure | $15M – $50M |
| Healthcare | Patient misidentification, billing errors, compliance violations | $25M – $100M+ |
| Retail / E-commerce | Inventory distortion, failed personalization, returns | $5M – $20M |
| Manufacturing | Supply chain disruption, quality control failures | $8M – $35M |
| SaaS / Technology | Churn prediction failure, product analytics blindspots | $3M – $15M |
| Professional Services | Resource misallocation, billing discrepancies | $2M – $8M |
The ROI of Fixing It: What a Data Quality Program Actually Returns
Enterprises that invest in structured data quality programs typically reach financial break-even within 6–12 months and generate cumulative returns of 3–7× their investment over 24 months. The following timeline models the typical financial arc of a data quality program against the baseline of taking no action.
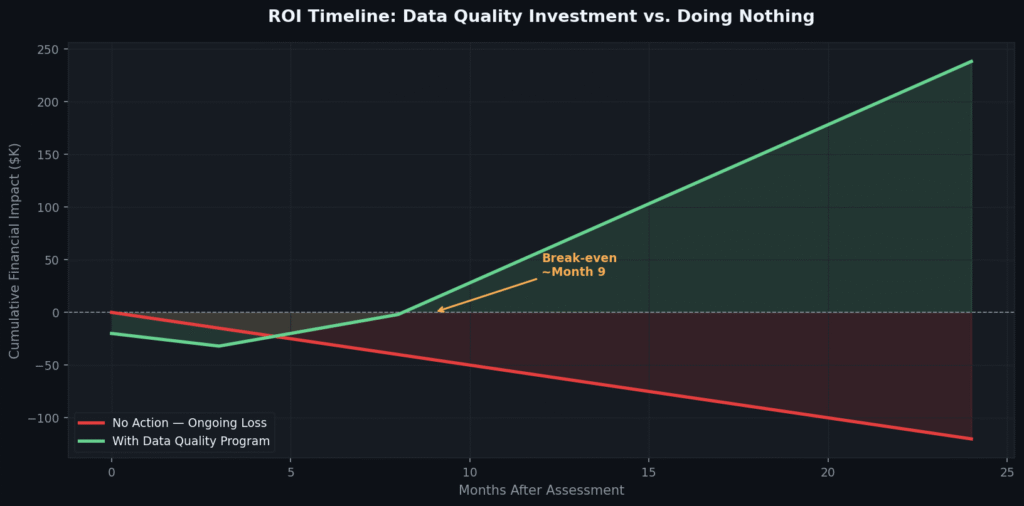
Fig 5. Modeled ROI trajectory: organizations that implement a structured data quality program typically break even by month 9 and generate compounding returns as cleaner data improves every downstream system it flows into.
The initial dip in the data quality investment curve reflects setup costs — tooling, governance framework development, and initial data remediation sprints. The inflection point arrives once automated validation is in place and the organization stops generating new bad data at the same rate it generates new records.
The Data Quality Maturity Model: Where Does Your Enterprise Stand?
Most organizations that struggle with bad data are operating at Level 1 or Level 2 maturity — aware that problems exist but without the governance framework to address them systematically. The maturity model below maps the progression from reactive chaos to proactive, AI-assisted data quality management.
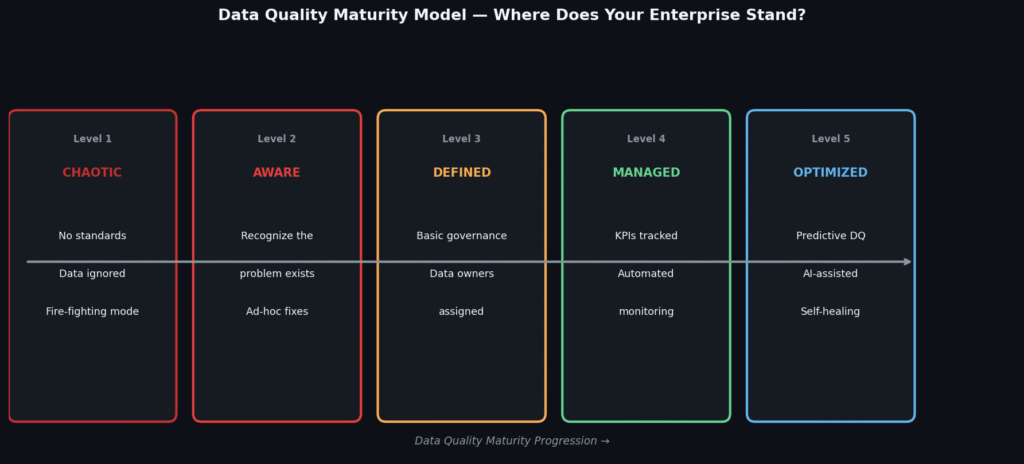
Fig 6. The Data Quality Maturity Model. Most enterprises sit at Level 2 (Aware) — they know bad data exists but address it reactively. Level 4 and 5 organizations use continuous monitoring and AI-assisted correction to prevent problems before they reach decision systems.
Understanding your current maturity level is the essential first step. It shapes which investments will deliver the fastest return, and prevents expensive tool purchases before the organizational readiness to use them is in place.
A 6-Step Roadmap to Fixing Enterprise Data Quality
A successful data quality improvement program is not a single project. It is a continuous capability that builds over time. The following roadmap is sequenced to deliver quick wins early while building the foundations for long-term data trust.
- 1Conduct a Data Quality AuditBefore investing in tools, understand your current state. Profile your top 5–10 critical data sources. Measure completeness, accuracy, duplication rate, and freshness. Quantify the cost of the current quality level in business terms.
- 2Assign Data Ownership and StewardshipData quality is a people problem as much as a technology problem. Every critical data domain — customers, products, financials — needs a named data owner who is accountable for its quality and has authority to enforce standards.
- 3Implement Data Validation at the Point of EntryEnforce formatting rules, mandatory fields, and real-time validation at every data intake point: web forms, APIs, manual entry screens. This is your highest-ROI investment because it stops the bleeding at the source.
- 4Establish a Master Data Management (MDM) StrategyDefine a single authoritative source of truth for each critical data entity — customers, accounts, products, employees. Integrate downstream systems to read from master records rather than maintaining local copies that drift.
- 5Automate Continuous Data Quality MonitoringImplement automated data quality dashboards that surface completeness rates, duplication counts, freshness metrics, and anomalies in real time. Reactive cleanup must give way to continuous monitoring with alerting.
- 6Build Data Quality Into Organizational CultureTools alone will not sustain data quality. Train teams on data hygiene practices. Include data quality metrics in team KPIs. Make the cost of bad data visible to every person who creates or uses data.
What “Good Data” Looks Like: The 6 Dimensions of Data Quality
Before your organization can improve data quality, it needs a shared definition of what “quality” means. The industry-standard framework identifies six measurable dimensions:
- Accuracy — Data correctly reflects the real-world entity it represents. Customer addresses match physical locations. Revenue figures match transactions.
- Completeness — Required fields are populated. Records have no meaningful gaps that would prevent them from being used for their intended purpose.
- Consistency — The same data entity is represented identically across all systems. No conflicting values for the same field across CRM, ERP, and finance tools.
- Timeliness — Data reflects current reality. Contact information, product pricing, and inventory counts are refreshed at a frequency appropriate to their business use.
- Uniqueness — Each real-world entity is represented exactly once. No duplicate customer records, duplicate product SKUs, or duplicate accounts.
- Validity — Values conform to defined business rules and formats. Phone numbers have correct digit counts. Dates are in defined ranges. Status fields use approved values only.
✅ Practical Starting Point
You don’t need to achieve perfection across all six dimensions simultaneously. Start by measuring your top three critical data assets on all six dimensions. Even a basic scorecard — shared at the executive level — creates organizational alignment around data quality as a business priority rather than an IT task.
Final Word: Data Quality Is a Revenue Strategy
The conversation about data quality has historically lived in the IT department. It has been framed as a maintenance problem, a compliance requirement, or a technical debt item competing for engineering bandwidth. That framing is wrong — and expensive.
Data quality is a revenue strategy. Every enterprise decision that flows from data is only as reliable as the data itself. Poor quality data doesn’t just create cleanup costs: it corrupts the decisions that shape product strategy, market positioning, customer relationships, and financial forecasting.
Organizations that treat data quality as a board-level business initiative — assigning ownership, measuring business impact, funding proactive programs — consistently outperform those that treat it as a reactive IT task. The gap in decision velocity, customer satisfaction, and revenue accuracy between these two types of organizations widens every year as AI and analytics become more central to competitive advantage.
The organizations that will win the next decade of business competition are not those with the most data. They are those with the most trustworthy data.—
Enterprise Data Strategy Principle
The cost of inaction is real, it is measurable, and it compounds quarterly. The cost of action — done strategically — is a fraction of that, with returns that extend across every system and every decision your organization makes.
Start with the audit. Make the cost visible. Assign the ownership. The rest follows.
