Every aspiring data analyst eventually hits the same wall: two tabs open, one for a Python tutorial, one for a Power BI course, and no clear sense of which one actually gets you hired first. It’s a reasonable place to get stuck. In 2026, SQL still leads analyst job postings at around 52.9% to 60%, but Power BI (roughly 24.7% to 43%, depending on the study) and Python (around 31% to 41%) are close behind — and both keep showing up together far more often than either shows up alone.
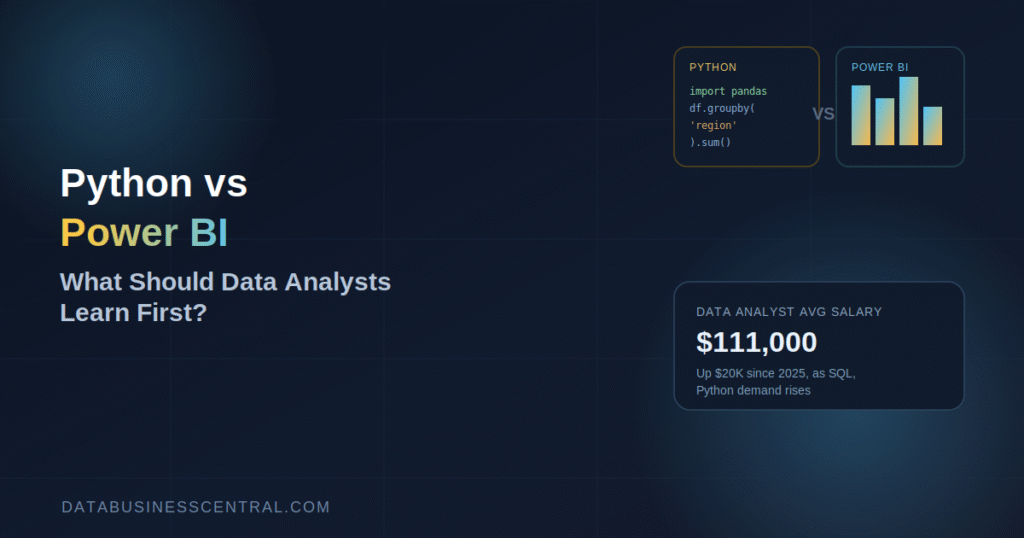
The stakes are real too. Data analyst salaries have jumped by about $20,000 since 2025, with the current average sitting near $111,000, and Python appearance in a job posting is increasingly one of the clearest signals of a higher salary band. So which should you actually learn first — Python or Power BI? The honest answer depends on where you’re starting from, but there’s a clear, evidence-based way to make that call. Here’s how to think it through.
What Power BI Actually Does
Power BI is a business intelligence tool built for turning data into dashboards and reports that non-technical stakeholders can understand at a glance. You connect it to a data source, drag fields onto a canvas, and build interactive visuals — bar charts, maps, trend lines — without writing much code at all. Its formula language, DAX, handles calculations and aggregations once you’re ready to go beyond the basics.
The appeal is speed. A beginner can connect a spreadsheet and produce a genuinely useful dashboard within a single afternoon. That immediate, visible payoff is a big part of why Power BI remains one of the most commonly requested visualization tools in analyst job postings.
What Python Actually Does
Python is a general-purpose programming language that, in the data world, is used mainly through two libraries: Pandas for cleaning and reshaping data, and NumPy for numerical operations. Rather than dragging and dropping, you write code that transforms messy, inconsistent data into something structured enough to analyze — then, if needed, extends into statistics, automation, or machine learning.
The learning curve is steeper up front. Where Power BI gives you a visible dashboard almost immediately, Python usually asks for a few weeks of syntax, logic, and debugging before you’re doing anything that feels like real analysis. The payoff comes later, but it’s substantial: Python scales to problems Power BI simply isn’t built to solve, like automating a recurring data-cleaning task or building a predictive model.
What the Job Market Actually Wants
This is where opinion gives way to evidence. Recent analysis of hundreds of real data analyst job descriptions found Power BI appearing in about 43% of postings and Python in about 41% — a near dead heat, with SQL still comfortably ahead of both. Another large-scale study of over a thousand postings put Power BI slightly ahead of Python in raw frequency, while Excel remained relevant in roughly 41% of listings.
The more interesting pattern isn’t which tool appears more often — it’s that they rarely appear alone. Employers increasingly expect analysts to query with SQL, clean and automate with Python, and present findings through Power BI or Tableau, treating the three as a connected toolkit rather than competing options. Choosing one over the other permanently isn’t really the choice in front of you; the real question is which one to prioritize first.
Does Python Actually Pay More?
There’s a genuine salary signal here worth taking seriously. Job postings that include Python tend to cluster in the higher salary bands more consistently than postings built primarily around visualization tools alone. That’s not because Power BI is a lesser skill — it’s because Python appears more often in postings for hybrid roles that blend traditional analysis with automation or light data engineering, and those roles tend to pay a premium.
That said, this isn’t a case for skipping Power BI. Roughly 69% of data analyst postings seek domain specialists with strong SQL and visualization skills specifically, meaning a huge share of the market still wants exactly what Power BI teaches you to do well: turn data into a story a business stakeholder can act on.
The Learning Curve, Honestly Compared
If you’re choosing based on how fast you can start being useful, Power BI wins clearly. Most beginners can build a working dashboard within their first week, which makes it an excellent confidence-builder and a fast way to produce something portfolio-worthy.
Python takes longer to feel productive in, typically several weeks of consistent practice before cleaning and analyzing real data starts to feel natural rather than frustrating. But once that initial curve is cleared, Python’s ceiling is considerably higher — it opens the door to automation, statistical testing, and eventually machine learning in a way drag-and-drop tools generally don’t.
So Which Should You Learn First?
The honest answer is: it depends on your starting point and your goal, and there’s a defensible case for either sequence.
Learn Power BI first if you’re brand new to data work, want to build a job-ready portfolio piece quickly, or you’re targeting business-facing analyst roles where translating data into a clear visual story is the core job. Fast wins early on build the confidence and motivation to tackle harder tools later.
Learn Python first if you’re comfortable with some technical learning curve already, you’re aiming for hybrid analyst/analytics-engineer roles, or your long-term goal includes moving toward data science. Since Python is one of the clearest salary signals in job postings and underpins the more advanced end of the analytics career ladder, starting there sets a stronger technical foundation to build on.
Learn SQL before either one if you haven’t yet — it remains the single most requested skill across analyst postings, and both Python and Power BI become dramatically more useful once you already know how to query a database confidently.
A Practical 90-Day Roadmap
If you want a concrete starting sequence rather than an abstract answer, here’s a path that reflects what the job market actually rewards:
- Weeks 1–3: SQL fundamentals. Learn to filter, join, and aggregate data — this underpins everything that follows and remains the top-requested skill in analyst postings.
- Weeks 4–7: Power BI basics. Build two or three dashboards using real public datasets. This gives you a portfolio-ready project fast and builds visualization instincts you’ll reuse in Python later.
- Weeks 8–12: Python fundamentals with Pandas. Focus specifically on data cleaning and basic analysis, not general programming theory — the goal is applying it to messy, real-world datasets, not becoming a software engineer.
- Ongoing: Combine them. Use Python to clean and prepare data, then load the result into Power BI for the final presentation layer. This mirrors exactly how hybrid analyst roles actually work day to day.
Side-by-Side: Power BI vs Python at a Glance
| Factor | Power BI | Python |
|---|---|---|
| Primary job | Build interactive dashboards and reports | Clean, transform, and analyze data at scale |
| Time to first useful result | Days | Weeks |
| Learning style | Drag-and-drop, visual | Written code, logic-based |
| Job posting frequency | ~25–43% (varies by study) | ~31–41% (varies by study) |
| Salary signal | Solid, especially with SQL | Stronger, especially in hybrid roles |
| Ceiling | Reporting, dashboards, DAX calculations | Automation, statistics, machine learning |
| Best paired with | SQL, Excel | SQL, Pandas, NumPy |
Use this as a quick gut-check, not a scoreboard — the honest takeaway from the data is that both show up together far more than either shows up alone.
Real Scenarios: Which Path Fits You?
Abstract advice only goes so far, so here’s how the decision plays out for a few common starting points.
A career switcher with no technical background, aiming for an entry-level analyst role in three to six months. Power BI first is the stronger bet here. A quick, visible win — a real dashboard built from a real dataset — gives you both a portfolio piece and the confidence to keep learning, without the frustration of debugging code before you’ve built anything tangible.
A recent graduate in a quantitative field (economics, statistics, engineering) targeting analyst or junior data scientist roles. Python first makes more sense, since you likely already have some comfort with logical, structured thinking, and starting there sets up a smoother path toward the more advanced, higher-ceiling parts of the field later.
A working professional in Excel-heavy reporting roles looking to formalize existing skills. Power BI first is a natural extension of what you already know — many of the concepts (pivoting, filtering, calculated fields) map directly onto skills you’ve likely already built in Excel.
Someone specifically eyeing a data scientist or analytics engineer track within two to three years. Python first, without much debate. Since Python is the dominant skill in that direction of the career ladder — appearing in roughly 57–64% of data scientist postings compared to well under half for analyst-focused roles — starting there avoids a harder pivot down the road.
Why This Isn’t Really an Either/Or Choice
Treating this as a permanent, exclusive decision misses how the tools actually get used together in practice. A typical modern analyst workflow looks like: pull data with SQL, clean and reshape it with Python when the transformation is too complex for point-and-click tools, then hand the polished result to Power BI to build the dashboard stakeholders actually see. Each tool does the part of the job it’s genuinely best at.
The sequencing question matters mainly for momentum and job-readiness timing, not because you’ll eventually abandon one for the other. Most analysts who reach a senior level know both reasonably well, and the ones who specialize deeply in just one tend to specialize in Python specifically, because that’s the direction the ceiling extends.
Final Thoughts
There’s no universally correct answer to Python vs Power BI: what should data analysts learn first — but there is a genuinely useful way to decide. If you need a fast, visible win and you’re targeting business-facing roles, start with Power BI. If you’re comfortable investing in a steeper learning curve for a stronger long-term ceiling, start with Python. Either way, don’t stop at one: the job market increasingly wants both, alongside SQL, and the analysts commanding the highest salaries in 2026 are the ones who treated this as a “both, in sequence” question rather than a permanent either-or.
Frequently Asked Questions
Can I get a data analyst job knowing only Power BI, without Python? Yes, especially for business-facing, domain-specialist roles that prioritize SQL and visualization — but adding Python later will noticeably widen your job options and salary range as your career progresses.
Is Python harder to learn than Power BI? Python has a steeper initial learning curve since it requires writing code rather than dragging and dropping visuals, but most learners with consistent practice become functionally productive with Pandas within six to eight weeks.
Should I learn SQL before Python or Power BI? Yes — SQL remains the most requested skill in data analyst job postings and makes both Python and Power BI significantly easier to learn, since most real-world data work starts with querying a database.
